

Abstract
Today’s undergraduate students often must balance coursework with other personal and professional commitments. While much attention has been placed on effective strategies for helping students manage workload, curriculum optimization has been largely overlooked. In an analysis of a university lower-level online STEM course, a course redesign reduced student workload, based on student and instructor feedback. Learner outcomes of performance (N=1215) and persistence (N = 1242) were evaluated. Results indicated that grade distributions were significantly different in the reduced workload scenario (p < 0.001). Sections with lower workload had more “A” final course grades (70% for lower workload sections compared to 58% for higher workload sections). Course failures were significantly reduced from 8.3% for higher workload sections to 3.2% for lower workload sections (p < 0.001). Additionally, course withdrawals were reduced from 1% to 0.5% (p < 0.001). Study results highlight the idea that student workload and outcomes are related. An excessive number of student assessments (“deliverables”) can negatively impact student performance and persistence in a course. This finding is particularly important for STEM courses which can also be seen as difficult or “barrier” courses by students. Implications for course developers and administrators include the idea that online courses do not require an excessive amount of student assignments to have academic rigor. Furthermore, assignments should be monitored to ensure they allow for adequate assessment of learning outcomes. Future work exploring workload reduction in various term lengths, disciplines, and modalities is warranted.
Keywords: asynchronous, online, workload, undergraduate
Author Bios
Dr. John Griffith Ph.D., (ORCID ID 0000-0002-6764-7031) is an Associate Professor with over 30 years of teaching and 15 years of educational leadership experience. He has published articles on teaching and learning, as well as education and emergency services leadership. Dr. Griffith currently serves in the Mathematics, Science and Technology Department in the worldwide Campus of Embry-Riddle Aeronautical University. He also served 23 years in the U.S. Air Force.
Emily Faulconer, Ph.D. (ORCID ID 0000-0002-7392-316X) is an associate professor in the Department of Mathematics, Science and Technology at Embry-Riddle Aeronautical University’s Worldwide Campus where she teaches chemistry, environmental science, and research methods. She also serves on the Academic Safety Committee, leveraging her expertise as a certified chemical hygiene officer.
Author Note
This study replicates Griffith’s previous research completed in 2023, “Does Removing Quizzes Negatively Impact Mid-term Exam Scores in an Online Course?” The 2023 study used data from a total of 657 students recorded in the November 2022 and January 2023 terms prior to workload reduction and two terms after workload reduction (February and March 2023).
This 2024 replication expanded the data analysis using grades from 1242 students 5 terms prior to coursework reduction (July through November 2022) and 5 terms after course sections with reduced workload were implemented (July-November 2023). Grades from 87 students from the November 2022 term were included in both the 2023 and 2024 studies.
Purpose
Online STEM courses have traditionally experienced more withdrawals and lower grades. The term “barrier courses” are commonly used to describe introductory STEM math or statistics courses. The fear is that if students do not persist beyond these “barrier courses, they will drop out of college altogether leading to lower overall retention of students and lower graduation rates. Online courses tend to have more graded assessments or “deliverables” required to pass the course than typically seen in face to face sections done in part to add rigor to online offerings (Bettinger & Loeb, 2017; Welding, 2023; Wyatt, 2005). This study was conducted to determine if a reduction in workload in asynchronous online courses can positively impact performance (measured as grade distribution and pass rate) and persistence (measured as withdrawals).
Literature Review
Persistence in STEM degrees has garnered international research attention (Fisher et al., 2022; Pedraza & Chen, 2022). As an increasing number of courses are taught asynchronously online, educators must carefully consider how to best support these learners. Course-level factors, including design and workload, account for a notable percentage of withdrawals from asynchronous online STEM courses (Bawa, 2016; Faulconer et al, in press). Furthermore, many students withdraw because of personal and professional conflicts that interfere with effective management of their course workload (Faulconer et al, in press). Faculty perspectives on attrition in online courses support this, noting course workload and student time availability as major factors (Xavier & Meneses, 2021). Student perceptions of workload are important as students already perceive STEM courses to have a higher workload than other courses (Lutes & Davies, 2018), though students may over-estimate their workload compared to the actual time invested on the coursework (Karner et al., 2015; Lutes & Davies, 2018).
It can be particularly challenging to estimate workload in online courses because students work independently and without discrete hours of contact time. Students completing online coursework inevitably vary in how long they invest in a given task (Faulconer et al., 2021). While it can be challenging to reliably evaluate their accuracy compared to actual time on task, student workload calculators can be used by instructors and course designers to determine if their course’s workload aligns with expectations based on the credit hours (e.g. Carnegie unit) of the course (Beer, 2019). Credit hours were originally designed with instructor contact hours in mind rather than student engagement hours. However, credit hours are relevant to students’ course workload selections as this is the official communication to students about workload when they are selecting courses. Students may seek supplemental information from peers, advisors, and any available course materials available. These sources of information can lead to misunderstandings of workload for lower versus upper-level courses as well as for STEM laboratory courses, which traditionally carry only one credit hour but have a higher expected number of contact hours. While the U.S. Department of Education defines a credit hour as one hour of classroom instruction and two hours of out-of-class time per week (Laitinen, 2012), the expected workload may vary institution to institution and this “out-of-class” time is more nebulous in the asynchronous online setting. Some researchers have even proposed new tools to help students understand workload in courses that goes beyond credit hour to help students anticipate and plan for the course workload (Borchers & Pardos, 2023).
Online course workload may, in some cases, significantly exceeding institutional credit hour workload expectations (Northrup-Snyder et al., 2020). For online course assessments, workload and time management are noted faculty concerns (Kearns, 2012). In fact, evidence in a non-STEM online course showed a correlation between a high assessment load (considering factors including total number, weighting, difficulty, and frequency) and course performance (Yu et al., 2023). Additionally, workload is correlated with student engagement (Yin & Ke, 2017). Disengagement in STEM is problematic (Glazier, 2022).
Pedagogical choices that faculty make in designing STEM courses can influence student perceptions on the appropriateness of the course workload as well as their course performance (Kulak & Newton, 2015). When instructors receive feedback regarding time on task, they are enabled to redesign course activities to address workload concerns (Hilliger et al., 2021). The total number of graded assignments and the total number of graded assignments per week has evidence of correlation with perceived workload (Pardos et al., 2023). Additionally, more deadlines that overlap in a term can lead to higher student stress levels (Pardos et al., 2023). The notion of reduced assessments in online STEM courses warrants investigation to determine the impact on student performance and persistence.
Preliminary research by the team examined the impact of removal of weekly quizzes in an online introductory statistics course on withdrawal rates and midterm exam scores (Griffith, 2023). All course sections were offered online over 9 week terms. Course sections used the same textbook and assessments with the exception that the control group included the weekly quizzes, and the treatment group had no quizzes. Course sections with lower workload experienced a reduction of the withdrawal rate from 5% to 1% (p = 0.02). Midterm exam scores differed by 0.3 of a point yielding a non-statistically significant result (p = 0.5). Grade distributions were not statistically different (p = 0.53), and failure rates were also similar at 4%. (Griffith, 2023).
The 2023 Griffith study showed no harm in performance by reducing workload with the noted benefit of possibly reducing withdrawal rates. Results of the 2023 study led to the idea of replicating the research with much larger data sets using similar dependent variables: withdrawals, failures, and grade distributions. The purpose of this analysis was to determine if a reduction in workload enhanced student performance. The methodology of this research can be used to assess courses in other disciplines besides statistics. The following hypotheses were tested:
Hypotheses
Ha1 Grade distributions of course sections with and without quizzes will differ.
Ha2 Course sections without quizzes will have fewer withdrawals than courses with quizzes.
Ha3 Course sections without quizzes will have fewer failing students than sections with quizzes.
Methods
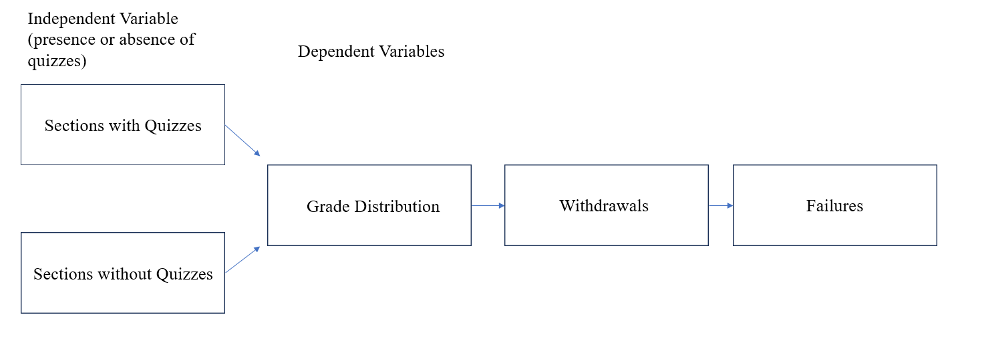
The hypotheses were investigated using a causal comparative AKA ex post facto investigation. Figure 1 shows the variables under examination.
Figure 1
Depiction of Independent and Dependent Variables
Course Context
The university course examined was a 200 level introductory statistics course offered online. Terms were nine weeks long divided into weekly modules. In this study, over 600 student grades from 2022 course sections which included quizzes and over 580 student grades from 2023 course sections which did not include quizzes were gathered after all courses had ended. All sections included graded homework for the first 8 weeks and scaffolding assignments and discussions. For each group of course sections, 5 terms of data were collected covering the same months of each year to eliminate possible seasonal confounding variables. The textbook and curriculum in all the course sections were identical with the exception of quizzes in the 2022 sections and no quizzes in the 2023 sections. The Canvas learning management system was used to deliver these online courses. Because of the templated nature of the course, workload variations based on the instructor were likely minimal. Courses where instructors have the least autonomy tend to have lower variations in workload than those with moderate autonomy (Lutes & Davies, 2018).
Course terms were 9 weeks long with 5 major terms a year (August, October, January, March, May). However, courses were also offered in July, September, November, February, and April. Online courses were offered in every term and comprised approximately 95% of all enrollments of the campus. Faculty were cleared to teach on a course by course basis subject to Southern Association of Colleges and Schools reginal accrediting guidelines. The university typically rated extremely high in online course programs by U.S. and News Report (2024).
Course Workload
Students typically studied two chapters per week with a discussion board or an assignment which involved spreadsheet work or short papers. In three of the nine weeks, both a discussion board and an assignment were due. The Canvas learning management system had a “deep integrated” Pearson MyLab component used for homework, module quizzes (for the 2022 sections examined), and the mid-term. Homework consisted of 10 questions over each chapter studied. A mid-term homework review contained 20 questions used to prepare for the midterm exam. All homework assignments allowed students multiple attempts for each question with the ability to ask their instructor questions regarding points of confusion. Quizzes did not have multiple attempts or instructor help options and had to be completed in one sitting. In the 2022 course sections (only), 15 question quizzes covered each weekly module. The midterm was 20 questions covering the first four modules of the course (7 chapters). The final exam did not use the Pearson platform.
The course included discussion boards on the normal curve (Empirical Rule), non-representative samples, data visualization, statistics in the media, confidence intervals, and how to read a t-Test output given a scenario. Additionally, assignments included calculating and charting a regression line and explaining what it means. Additional assignments covered data visualization, random number generators and a refection video. The final exam was broken into two parts. The first part of the final exam was determining what type of t-Test to run, forming a hypothesis in plain language, and determining an alpha level. The second part of the final exam was to run the appropriate t-Test in Microsoft Excel and interpret the results.
Population, Sample, and Measures
The study was conducted at a mid-sized university. Students were typically in their mid-30s and were working adults. Approximately 50% of the students were active or reserve military personnel. An additional 30% were spouses of military or veterans under the GI Bill. Approximately 24% of the population was female.
The population for this study was the total number of learners enrolled during the timeline of this study. Five terms of course sections were examined both with and without quizzes covering July – November 2022 (with quizzes) and July – November of 2023 (without quizzes). Data was taken from a university Oracle based “dashboard” analytics tool which aggregated grades for terms and course sections specified by the researcher. Specific student identification data was not available in the dashboard portal. The analytics dashboard is commonly used as a management tool to identify trends with university courses and programs.
Data Analysis
Grade distributions and failures were compared between 2022 courses sections with (N=629) and 2023 sections without (N=586) quizzes. Ressearchers viewed withdrawals as a separate event from grade distributions and failures. Withdrawal group sizes were slightly larger as noted below since they contained all students who registered for the course, not just those who received a final grade.
Withdrawals were also evaluated using Chi Square contingency table. The 2022 course section data in which courses contained quizzes (N=653) were compared with 2023 course sections which did not have quizzes (N=589).
All data were gathered after terms under study were completed. Hypotheses were evaluated using Chi Square contingency tables due to the nominal nature of the data. Because similar data were tested for the three hypotheses, a Bonferroni adjusted significance level of 0.016 was used to guard against Type I errors (Gay et al., 2009). Cramer’s V was used as a post hoc test (strength of association) for significant findings (Gay et al., 2009).
Results
Three hypotheses were analyzed. The first hypothesis stated that the grade distribution would differ between course sections that included quizzes and sections that did not. The second hypothesis postulated that course sections without quizzes would have a lower number of student withdrawals than course sections that included quizzes. The final hypothesis suggested that course sections without quizzes would have a lower number of failures (“F” grades).
Grade Distribution
There was evidence to support the idea that the grade distributions between course sections that included quizzes (N=629) and sections that did not (N=586) would differ. Withdrawals were not included in this analysis of grade distributions. Figure 2 shows the grade distributions of both groups.
Figure 2
Grade Distribution Comparison
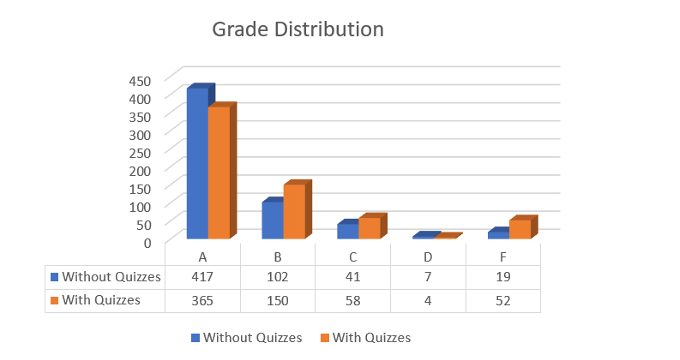
Course sections without quizzes had more “A” grades (71%) than sections with quizzes (58%). Sections without quizzes had a lower percentage of “B” and “F” grades (17% and 3.2% respectively) than sections with quizzes (24% and 8.3% respectively). Both groups had similar percentages of “C” (between 7 and 9%) and “D” (around 1%) grades. These data supported the idea that grade distributions were significantly different between course sections with and without quizzes ( = (4, N=1215) = 30.19, p < 0.001). Cramer’s V which measured strength of association also statistically yielded a significant result (V = 0.158, p < 0.001).
Withdrawals
A key indicator of students’ willingness to persist in a course is the number of student withdrawals. In this study, course sections without quizzes (N=589) had a lower number of student withdrawals than sections that included quizzes (N=653). Figure 3 shows this comparison.
Figure 3
Frequency of Withdrawals Comparison
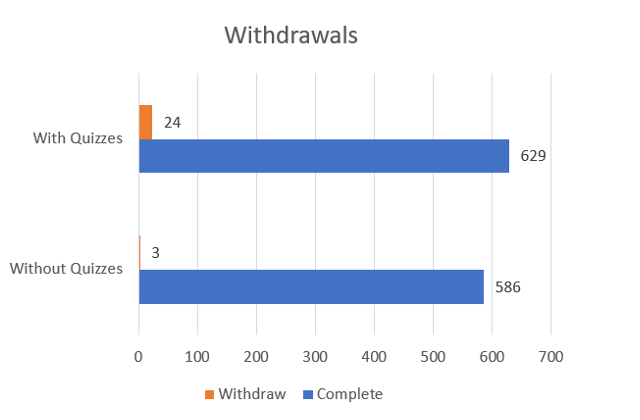
Course sections with quizzes experienced a withdrawal rate of 3.7%. Course sections that did not include quizzes had a lower withdrawal rate of 0.5%. The difference in withdrawals between the groups was statistically significant ( = (1, N=1242) – 14.6, p < 0.001). Strength of association as noted by Cramer’s V was also statistically significant (V = 0.108, p < 0.001). In this study, the data supported the idea of a relationship between less workload and lower withdrawal rates.
Pass/Fail
As noted in Figure 2, course sections with quizzes (N=629, 8.3% failure rate) had a higher number and percentage of failures (“F” grades) than course sections without quizzes (N=586, 3.2%). Withdrawals were not included in the calculations when examining possible differences in the pass/fail analysis. Figure 4 shows the comparison.
Figure 4
Pass/Fail Comparison
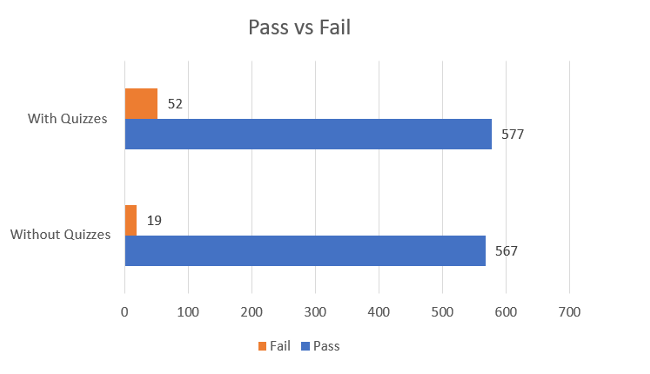
Courses sections that included quizzes experienced significantly higher number of failures than course sections that did not use quizzes ( = (1, N=1215) = 13.92, p < 0.001). The Cramer’s V strength of association result was also statistically significant (V = 0.108, p < 0.001). In this study, statistical results supported the idea of a relationship between less workload and fewer failing students.
Discussion
In this study, reducing workload led to statistically significant positive changes in the grade distribution, fewer withdrawals, and fewer failing students. Effect sizes were moderate. These results support the idea that it is possible to put too many student assessments (AKA “deliverables”) in a course. Unnecessarily heavy workloads can serve as a disincentive for students to attempt a course resulting in a withdrawal or cause students not to persist in completing coursework after the withdrawal period has ended. These results add to the discussion of carefully determining the appropriate number of graded assessments which will help students effectively learn a subject without discouraging them from attempting or completing a course.
It is important to note that there is some evidence that there is a weak correlation between time on task and learner outcomes (Karner et al, 2015). However, other research has shown that time on task does not correlate to improved outcomes (Faulconer et al, 2021). The study presented here provides further evidence that time on task is a nuanced variable.
Faculty may be reluctant to reduce workload due to a concern that they will be perceived as attempting to inflate student evaluations of their teaching. However, research suggests that there is no correlation between lighter workload and positive student evaluations, though a challenging course with high engagement expectations negatively impact student evaluations (Thorton et al., 2010).
Conclusions
Grade distributions were notably different between the two groups of course sections examined, possibly indicating a willingness by students to persist in course assignments to achieve more “A” grades and fewer failing (“F” grades) in course sections with no quizzes (fewer assessments or “deliverables”). This result is constant with findings noted by Kochu et al. (2022) and Sandars et al. (2020) regarding the possible negative impact on student performance caused by too many assignments.
The reduction in withdrawal rates noted in this study are also consistent with a previous study by Griffith (2023) which found that decreasing workload is also related to reducing withdrawal rates. The balance between ensuring academic rigor and putting too many assignments into a course can be struck by closely monitoring course metrics such as grade distributions, withdrawals, and failures. Additionally, course developers should keep track of inputs from faculty and students regarding course workload and content. However, course developers should also consider getting inputs from university administration who may be able to access metrics more easily or comprehensively. Courses should be monitored using the measures discussed above in order to make improvements that meet the intent of course developers and administrators while also serving student needs.
Limitations
This research has several limitations to consider when evaluating the results presented. First, the student population of this research was non-traditional in several important ways. Students tended to be military affiliated, in their thirties and 76% male. All of these traits differ from students found on a typical campus which has younger, non-military affiliated students and a more equal gender balance.
Secondly, effect sizes noted in the study results were moderate meaning other variables besides the reduction in workload might have impacted the change in grade distribution, reduction in the number of withdrawals and reduction in the number of failing students. This limitation makes these findings no less relevant but should be considered if the study is replicated.
Third, the university in which the study took place is a non-for-profit institution with regional accreditation and may have different levels of course support such as instructional design elements in support of effective instruction. The university has been rated as the 13th best university for undergraduate online degree programs and fifth best bachelor’s programs for veterans (U.S. News and World Report, 2024). The uniqueness of how the university operates may have impacted the results of this research.
Fourth, the sample was taken in the months of July through November for two consecutive years to assign the groups for comparison. Further research would be required to determine if similar results could be expected for students who took courses from December through June or other time frames during the year.
Lastly, the university in this study operated on a 9 week term which differs from traditional term lengths of 15 or 16 weeks. There is some evidence that term length can influence workload in undergraduate courses, with shorter terms having a small but statistically significant reduction in workload (Lutes & Davies, 2018). For this reason, care should be taken in generalizing results noted in this study to other course term lengths.
Recommendations
Researchers should continue to assess research questions regarding student workload and its impact on performance in online settings. As noted earlier, past researchers have argued that excessive workload can have a negative impact on student performance.
Administrators and course designers should have regular discussions about course learning outcomes and how they are being assessed. Academic rigor is an important aspect of any course development effort; however, it is important to only assess outcomes that are a part of written course learning outcomes so as not to overload students with an excessive number of assessments (“deliverables”).
Future researchers should use the study methodology to examine the impact of workload on student performance in more traditional student settings to include both public and private universities.
Acknowledgements
We would like to acknowledge college leadership who funded this project. In addition, we would like to acknowledge all of the hard working faculty for their efforts in designing and delivering effective courses. Lastly and most importantly, we would like to acknowledge all of the military and military affiliated students who not only serve our country but who also strive to make their lives better through education.
References
Bawa, P. (2016). Retention in online courses: Exploring issues and solutions—A literature review. Sage Open, 6(1). https://doi.org/10.1177/2158244015621777
Beer, N. (2019). Estimating Student Workload During the Learning Design of Online Courses: Creating a Student Workload Calculator. European Conference on E-Learning, 629-638,XI. https://eprints.lancs.ac.uk/id/eprint/140685/
Bettinger, E., Loeb, S. (2017). Promises and pitfalls of online education. Brookings. https://www.brookings.edu/articles/promises-and-pitfalls-of-online-education/
Borchers, C., & Pardos, Z. (2023). Insights into undergraduate pathways using course load analytics | LAK23: 13th International Learning Analytics and Knowledge Conference. LAK23: 13th International Learning Analytics and Knowledge Conference, 219–229. https://dl.acm.org/doi/abs/10.1145/3576050.3576081
Faulconer, E., Griffith, J., & Frank, H. (2021) If at first you do not succeed: Student behavior when provided feedforward with multiple trials for online summative assessments. Teaching in Higher Education, 26(4), 586-601. https://www.tandfonline.com/doi/full/10.1080/13562517.2019.1664454
Faulconer, E., Wood, B., Branton, A., & Chuaunsu, M. (in press) Why students withdraw from online STEM courses. Quarterly Review of Distance Education.
Fisher, C. R., Brookes, R. H., & Thompson, C. D. (2022). ‘I don’t Study Physics Anymore’: A Cross-Institutional Australian Study on Factors Impacting the Persistence of Undergraduate Science Students. Research in Science Education, 52(5), 1565–1581. https://doi.org/10.1007/s11165-021-09995-5
Hilliger, I., Miranda, C., Schuit, G., Duarte, F., Anselmo, M., & Parra, D. (2021). Evaluating a Learning Analytics Dashboard to Visualize Student Self-Reports of Time-on-task: A Case Study in a Latin American University. LAK21: 11th International Learning Analytics and Knowledge Conference, 592–598. https://doi.org/10.1145/3448139.3448203
Gay, L. R., Mills, G. E., & Airasian, P. W. (2009). Educational research: Competencies for analysis and application (9th ed.). Pearson.
Griffith, J. (2023). Does removing quizzes negatively impact mid-term exam scores in an online course? Online Journal of Distance Learning Administration 26(2), https://ojdla.com/articles/does-removing-quizzes-impact-student-performance-in-an-online-course
Karner, T., Egloffstein, M., Binoder, F., Frotschl, C., & Schley, T. (2015). Workload, time-on-task, and learning outcome in online learning for beginning students. Zeitschrift fur Hochschulenwicklung, 10(4), 209-231. https://kops.uni-konstanz.de/entities/publication/9a34bfd0-cec8-4ba7-8f3a-2acc72f97c4f
Kearns, L. (2012). Student assessment in online learning: Challenges and effective practices. Journal of Online Learning and Teaching, 8(3), 198–208.
Kochu, et al., (2022). Student workload assessment for online learning: An empirical analysis during Covid-19). Cogent Engineering, 9(1). https://www.tandfonline.com/doi/full/10.1080/23311916.2021.2010509
Kulak, V., & Newton, G. (2015). An Investigation of the Pedagogical Impact of Using Case-Based Learning in a Undergraduate Biochemistry Course. International Journal of Higher Education, 4(4), 13–24.
Laitinen, A. (2012). Cracking the Credit Hour. New America Foundation. https://eric.ed.gov/?id=eD540304
Lutes, L., & Davies, R. (2018). Comparison of Workload for University Core Courses Taught in Regular Semester and Time-Compressed Term Formats. Education Sciences, 8(1), Article 1. https://doi.org/10.3390/educsci8010034
Northrup-Snyder, K., Menkens, R. M., & Ross, M. A. (2020). Can students spare the time? Estimates of online course workload. Nurse Education Today, 90, 104428. https://doi.org/10.1016/j.nedt.2020.104428
Pardos, Z. A., Borchers, C., & Yu, R. (2023). Credit hours is not enough: Explaining undergraduate perceptions of course workload using LMS records. The Internet and Higher Education, 56, 100882. https://doi.org/10.1016/j.iheduc.2022.100882
Pedraza, L., & Chen, R. (2022). Examining Motivator Factors of STEM Undergraduate Persistence through Two-Factor Theory. The Journal of Higher Education, 93(4), 532–558. https://doi.org/10.1080/00221546.2021.1999722
Sandars, J., et al. (2020). Twelve tips for rapidly migrating to online learning during the COVID-19 pandemic. MedEdPublish. https://opus.bibliothek.uni-augsburg.de/opus4/frontdoor/deliver/index/docId/80117/file/80117.pdf
Thorton, B., Adams, M., & Sepehri, M. (2010). The impact of students’ expectations of grades and perceptions of course difficulty, workload, and pace on faculty evaluations. Contemporary issues in Education Research, 3(12). https://eric.ed.gov/?id=EJ1072684
U.S. News and World Report. (2024). Embry-Riddle Aeronautical University - Worldwide: Online bachelor’s programs. https://www.usnews.com/education/online-education/embry-riddle-aeronautical-university-1479/bachelors
Xavier, M., & Meneses, J. (2021). The Tensions Between Student Dropout and Flexibility in Learning Design: The Voices of Professors in Open Online Higher Education. International Review of Research in Open and Distributed Learning, 22(4), 72–88. https://doi.org/10.19173/irrodl.v23i1.5652
Welding, L. (2023). U.S. College enrollment decline: Facts and figures. Best Colleges. https://www.bestcolleges.com/research/college-enrollment-decline/#:~:text=Today%2C%20fewer%20people%20are%20going,lowest%20fall%20enrollment%20since%202006.&text=The%20NSCRC%20estimates%20that%20even,2023%2C%20just%2014.1%20million%20students.
Wyatt, G. (2005). Satisfaction, academic rigor and interaction: Perceptions of online instruction. Education 125(3), 460–468. https://web.s.ebscohost.com/abstract?direct=true&profile=ehost&scope=site&authtype=crawler&jrnl=00131172&AN=16712162&h=%2fG8folYSmkbiyoeAJv6BXzGMo7dH7F8kubLbCq2CwGNjHngg1OFpTWrF0jYJb3Dz7GuXHTgbG2veKvet4JgRuA%3d%3d&crl=c&resultNs=AdminWebAuth&resultLocal=ErrCrlNotAuth&crlhashurl=login.aspx%3fdirect%3dtrue%26profile%3dehost%26scope%3dsite%26authtype%3dcrawler%26jrnl%3d00131172%26AN%3d16712162
Yin, H., & Ke, Z. (2017). Students’ course experience and engagement: An attempt to bridge two lines of research on the quality of undergraduate education. Assessment & Evaluation in Higher Education, 42(7), 1145–1158. https://doi.org/10.1080/02602938.2016.1235679
Yu, D., Swanepoel, C., Sims, D., & Anciano, F. (2023). Do Assessment Loads Affect Student Academic Success? An Investigation at an Economics Department at the Undergraduate Level. South African Journal of Higher Education, 37(5), 237–259. https://doi.org/10.20853/37-5-5397