
Abstract
Data for 295 college online introductory statistics students were examined to determine if removing four module (weekly) quizzes impacted student performance on a cumulative exam. In this research, student performance was not significantly impacted by the removal of the quizzes. The difference in the exam mean score earned by the group of students who did not take quizzes was less than 0.8 of a point lower than the exam average for students who took the quizzes prior to the exam. Withdraw rates significantly declined from 5 percent to 1 percent. Results of this study support the idea that course designers can explore reducing the amount of work in online courses to decrease extraneous cognitive load on students as long as learning outcomes are met. STEM courses are often seen as barriers for students in completing coursework toward degree accomplishments. Effectively designed coursework that does not unnecessarily duplicate evidence of achieving course objectives may also aid in student persistence and retention. Future researchers can examine methods used in this study to evaluate courses in more traditional 16-week term lengths in different university settings.
Purpose
Online courses emerged from correspondence courses and were viewed in a negative light when compared to traditional face to face instruction (Peterson, 2019, Wyatt, 2005). As a result, some online course developers overcompensated by including too many learning activities in courses as a means of assuring academic rigor (Wyatt, 2005). As the percentage of online courses continued to increase at the expense of face to face classroom course sections, more online offerings with an abundance of graded deliverables were developed, again emphasizing academic rigor (Bettinger & Loeb, 2017; Welding, L. 2023). STEM courses have the added complexity of being considered barrier courses for students attempting to complete their coursework (Jaggars et al., 2013; Currie, 2014). The statistics course in this study included homework, quizzes, a pre-midterm homework review, midterm, and final practical exam. The purpose of this study was to determine if removing the quizzes impacted student performance in any meaningful way.
Introduction and Literature Review
Distance learning has been a part of the educational landscape since the early 1700s beginning with correspondence courses in Boston (Gensler, 2014). Growth continued using radio (1919) and television starting in the 1950s. Even then, the argument was made that instruction could be as effective as face to face instruction. The world wide web accelerated the progress of distance education courses from the early 1990s. However, as with the case of NYU Online and other online program initiatives, distance learning programs did not always survive. Blended and hybrid programs initially helped fill the gap between online and face to face courses offering benefits of both delivery systems (Palvia et al., 2018). Learning Management Systems e.g. Canvas, WebCT, and Blackboard, supported the expansion of distance (online) learning with features such as discussion boards, support for video conferencing and the ability to easily make course videos among other features. In the U.S., major universities are expanding online offerings arguably to maintain or expand market share. Students select online courses due to time management, (Fidalgo et al., 2020), the perception that online degrees can be attained without driving to class, and at less overall expense ($36,000 cheaper over four years) than an on-campus degree (Hansen, 2023). But still the old question remained: Is online equivalent in quality to face-to face-instruction (Palvia et al., 2018)?
Online Courses and Academic Rigor
Academic rigor is measured by many different things depending on the university, but overall, in the U.S., regional accreditation is one objective method to determine if online instruction compares to face-to-face instruction. Accreditors with faculty experience examine programs and student performance outcome data that indicate if programs possess academic rigor and timely progression through degree programs. Because of improvements in andragogy, technology, and instructor experience with developing and teaching online courses, 77 percent of academic leaders believe online courses are at least equivalent if not better than face to face courses (Cooke, 2023). According to Busteed (2019) 85 percent of students who had taken both face to face and online courses rated the online experience equal to or better than face-to-face instruction.
In 2004, Bernard et al., (2004) conducted a meta-analysis of 232 studies from 1985-2002 comparing distance learning to classroom instruction. Online courses showed higher failure rates but scored higher in achievement and student attitudes when compared to traditional classroom instruction. Recent studies have shown online students do as well or better than their face-to-face counterparts if they persist in the course. These results held true in undergraduate statistics (Griffith et al., 2021), physics (Faulconer et al., 2018) and research methods courses (Roberts et al., 2019).
Researchers such as Sheridan (2006) have discussed workload issues from the instructor workload perspective. McLain (2019) compared face-to-face to online teaching determining no meaningful difference in time commitment for faculty. However, experience with Covid-19 has reiterated the idea that students also have significant time restraints as well when taking courses. Many non-traditional students work full time and have families. Education often falls below work and family in priorities. Creating many activities to assess student learning is not as important to students as the effective design and flow of course assignments (Kochu, et al., 2022; Dhawan, 2020). Kochu et al. (2022) further broke down results of 223 surveys determining that student workload was the number one expressed concern by survey takers followed by activities that were mentally demanding.
Online course failure and attrition/withdrawal rates have been higher than traditional face-to-face courses (Bernard et al., 2004; Griffith et al., 2021). Many explanations, such as lack of personal connection and skills associated with taking courses online, were offered in addition to workload factors. Online STEM courses offer a unique challenge to many students because most are regarded as mentally-demanding subjects. Possible factors such as student experience with online learning, experience with subject matter, first time (in the family) college student, mentally demanding tasks, and excessive workload all serve to be cumulative on their negative impact on student performance (Kochu et al., 2022; Sandars et al., 2020).
Strategies to reduce attrition rates have included emphasis on increasing faculty student interaction using tools such as discussions, announcements, grading feedback, and embedded videos (Griffith & Faulconer, 2022; Sandars et al., 2020). Researchers have focused on how to set up courses in a learning management system that avoids confusion, makes expectations clear and improves student instructor interaction (Dunlap, 2005). This study attempts to expand the discussion in the literature to include workload issues as causes for poor student outcomes such as lower grades and persistence.
Hypothesis
Ha1 Students who are required to complete chapter homework and quizzes prior to taking the midterm exam will perform differently on the midterm exam than students who are only required to complete the homework assignments.
Ha2 There is a relationship between extraneous workload and student withdrawals.
Methods
This analysis for the first hypothesis regarding midterm scores consisted of five course sections without weekly quizzes and eight course sections with weekly quizzes. The midterm scores of the 100 students without quizzes were compared to the midterm scores of 195 students who took weekly quizzes in each of the four weeks prior to the midterm.
Withdrawal rates were measured by comparing two terms immediately prior to the reduction in course requirements (n=291) to the rates for the two terms after (n=366) to determine if withdrawal rates were reduced in any meaningful way. Students were not aware they were in a study and the procedure was approved by the university human subjects board as exempt. No students were contacted. All midterm scores, grade distributions and withdrawal rates were evaluated after the fact.
The Course
A 200-level statistics basic college statistics course was used in this study. All students took the course online. The statistics course is required for most college majors in a medium sized university with annual enrollments of 2,000 to 2,500. A new term starts every month with the exception of December and June. The university operates on 9-week terms. Subsequently, the course covered one module per week. The dependent variable for the first hypothesis in question was student performance on the midterm exam. The independent variable was presence or absence of module quizzes. Five course sections were offered without weekly quizzes and eight sections included weekly quizzes. All 13 course sections used in the study used the same textbook, assignments, discussions, homework, and midterm. Additionally, all courses were offered on the Canvas learning management system. Typical weekly modules included two chapter homework activities aided by a Pearson third-party program, and a discussion or assignment.
The second hypothesis regarding withdrawal rates was measured for two terms prior to and two terms immediately after the reduction in course load. Students had the option of withdrawing from a class up to four weeks after the term start date.
Faculty cleared to teach the 200-level statistics course had undergone courses in teaching and learning. As with all university course clearances, instructors were approved to teach the specific 200-level statistics course. Once cleared, they could teach multiple sections over multiple terms. Instructors could be contacted through the course messaging system, as a response to assignment feedback or through e-mail. Video conferencing with the instructor was available and encouraged. Students also had access to a 24/7 tutoring service paid for by the university.
Participants and Demographics
The university operated on a 9-week accelerated format. The online format of courses offered, and shorter term lengths were seen as a benefit in the military community which typically experiences frequent moves. The course in this study was an introduction to statistics rated at three credits using the semester credit hour system as were most courses in student degree programs. Approximately 76 percent of the population was male. Most students (80 percent) were affiliated with the military either active duty, veteran, or a military family member. Students were typically in their late 20s to early 30s, worked full time and had a family. A total of 295 student grades were analyzed after midterms were completed for both samples used in the study. No student contact was made by the researchers for this analysis.
Student course grade distribution and withdrawal data from two terms immediately prior versus two terms immediately after the removal of quizzes were compared (n=657).
Homework, Quizzes and Test Design
Each of the weekly homework assignments included 10 questions, most with multiple parts offered using the Pearson third party platform which was embedded into Canvas. Students had multiple attempts at each question and could access demonstrations on like problems or send a screen shot to their instructor regarding a problem. Homework was used by all students in the study.
The presence or absences of quizzes served as the independent variable in this research. Quizzes were delivered using the Pearson third party software, consisted of 10 multiple part questions, and were presented at the end of each week (module). Students could take the quizzes twice. Students could contact instructors with questions after the quiz was complete. Quizzes were taken by students in eight of 13 course sections in this study.
The midterm was also delivered through Pearson and consisted of 20 questions, most with multiple parts to the question. Students had only one attempt to complete the timed midterm which was limited to two hours. The midterm was the dependent variable in this study and served as the basis of comparison between the eight course sections that took quizzes and the five that did not.
Treatment of the Data
The eight course sections that included weekly quizzes started in the January 2023 term. Five course sections without quizzes started in the February 2023 term. Performance on the midterm exams between the two groups of data were compared to determine if there was any meaningful difference. The hypothesis was evaluated using a t test for independent samples (α=.05) and showed a non-statistically significant finding. However, the Shapiro-Wilk normality test showed a p value below .05 for both groups, (with quizzes, W= 0.875, p<.001; without quizzes, W= 0.875, p<.001) meaning we could not assume that the distributions were normally distributed (Gay et al., 2009). Figure 1 below shows the distributions.
Figure 1
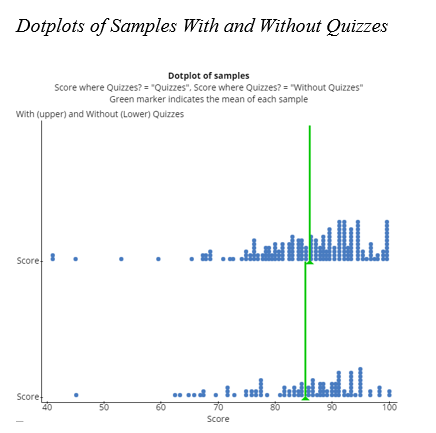
Note. The top dotplot distribution shows midterm grade results for students who took weekly quizzes. The bottom dotplot distribution shows midterm grade results for students who did not take weekly quizzes during the course. Although not important to the non-parametric analysis that follows, means for the two groups were 86.1 for the group who took weekly quizzes and 85.4 for the group that did not take weekly quizzes. Data were analyzed using StatCrunch.
The median for the eight sections with quizzes (n=195) was 88.3 (IQR 80.9 - 92.6). The median for the five sections without quizzes (n=100) was 88.0 (IQR 79.7 - 92.1). The hypothesis was evaluated using Mann-Whitney U non-parametric test because the distributions were not normally distributed. The significance level used was α=.05 (Gay et al., 2009).
The second hypothesis regarding withdrawal rates was measured using Chi Square (α=.05). Care was taken to measure withdrawal rates in the two terms just prior to, and just after the changes were made to the course to reduce the possibility of any extraneous variables impacting the results (Gay et al., 2009). Grade distributions were also examined to evaluate any changes.
Results
Two hypotheses were evaluated. The first examined the impact of quizzes on midterm exam scores. Supplemental data analysis focused on grade distributions between course sections with and without quizzes. The second hypothesis was focused on withdrawal rates for courses with and without quizzes.
Removal of Quizzes and Midterm Scores
Two samples of midterm scores for sections with and without quizzes were analyzed to determine if a meaningful difference could be identified between the two groups of students. Mann-Whitney U results did not provide enough evidence to support the idea of a difference in performance between the two groups (U = (195with quizzes, 100without quizzes), 29328, p=0.50).
Figure 2 contains boxplots for the two groups.
Figure 2
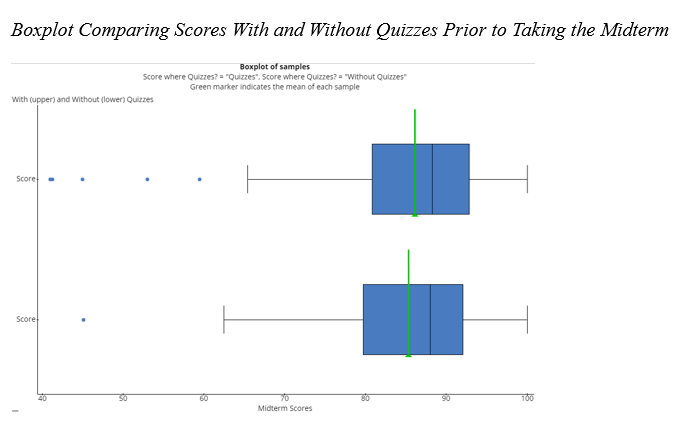
Note. The median for the eight sections (upper boxplot) with quizzes (n=195) was 88.3 (IQR 80.9 - 92.6). The median for the five sections (lower boxplot) without quizzes (n=100) was 88.0 (IQR 79.7 - 92.1). The green bar shows the means for each sample which were 86.1 and 85.4 respectively.
In this study, results for the two groups were quite similar not providing enough evidence to reject the null hypothesis. Removing the quizzes did not seem to dramatically impact midterm scores.
The natural question to ask is if grade distributions or withdrawal rates were impacted by reducing course workload. Grade distributions were not impacted in any significant way as shown in Table 1.
Table 1
Grade Distribution
| Grade | With Quizzes | Percentage | Without Quizzes | Percentage |
| A | 177 | 64% | 247 | 68% |
| B | 65 | 23% | 66 | 18% |
| C | 23 | 8% | 31 | 9% |
| D | 2 | 1% | 5 | 1% |
| F | 10 | 4% | 13 | 4% |
| Total | 277 | 100% | 362 | 100% |
Note. Percentages are rounded. With quiz grade distribution taken from Nov 2022 through January 2023 terms. Without quizzes grade distribution taken from February/March 2023 terms.
An independent samples Chi Square test did not show enough evidence that the grade distributions and reduced course workload (no quizzes) were related, (x2(4, N= 639) = 3.18, p = 0.53). The second hypothesis regarding withdrawal rates was also examined using Chi Square.
Withdrawal Rates
In the two terms prior to the reduction of course workload, 14 of 291 (5%) students withdrew from their course. In the two terms after workload reduction, 4 of 366 (1%) of students withdrew. It should be noted that a total of eight quizzes were removed from the course (one for each module week with the exception of the midterm). In this study, there was a significant relationship between reduced workload and retention rates, (x2(1, N= 657) = 8.41, p = 0.004). The course sections without the quizzes had a significantly lower withdrawal rate.
A secondary analysis was done comparing the February and March 2023 terms as a group (without quizzes) and the February and March 2022 terms which used quizzes. The February/March 2023 group (without quizzes) showed four withdrawals by 366 students (1%). The February/March 2022 data (with quizzes) showed 16 withdrawals for 435 enrollments (4%). The results showed a significant relationship between reduced workload and retention rates (x2(1, N= 801) = 5.46, p = 0.02). Similar to the primary analysis of this hypothesis; course sections without quizzes had a significantly lower withdrawal rate.
Discussion
Results in this study indicated that course sections without quizzes scored within a point of sections with quizzes on the midterm exam. This finding supports the idea that accountable (graded) homework assignments can reduce the need for quizzes prior to students taking an exam. Grade distributions between course sections with and without quizzes did not support the idea that the absence of quizzes impacted end of course scores in any meaningful way. The extra time needed for students to take quizzes may not be required to ensure effective student performance. Lastly, student withdrawal rates were significantly reduced for course sections without quizzes. Reducing withdrawal rates is a key goal for universities to improve student persistence and retention.
Conclusions
There was no relationship on midterm scores between course sections with and without quizzes. Moreover, grade distribution and failure rates were similar between the two groups lending to the idea that the academic benefit of assessing learned concepts in a quiz that follows graded homework does not materially improve student performance. The result of no harm done by removing quizzes aligns the findings of this study with ideas brought by Kouchu, et al., (2022) and Dhawan, (2020) who emphasized the design and flow of course assignments as well as Sheridan’s research on workload (2006).
The reduced withdrawal rate for course sections without quizzes noted in this study supports ideas postulated by Sandars et al., (2020) regarding student perceptions of workload, time management and persistence. Concerns about academic rigor tend to add more student activities to courses reinforcing concepts and demonstrate learning has taken place. However, student workload concerns have an impact on persistence and these concerns can impact student success in achieving a degree. If course designers can remove extraneous workload and still meet course objectives without degrading student performance, student success is sure to follow.
Limitations
The university used in this research has a large non-traditional student body which is different from more traditional settings. For these reasons, the results found in this study should be generalized to different settings with caution.
Traditional college semesters are 15-16 weeks long compared to the 9 week term length for the university in this study. No controls for the shorter timeframe were used in this research.
Traditional college students tend to be 18-22 years old with few affiliated with the military and a majority of female students. Students who took the course used in this study differed in age (upper 20s, lower 30s), were military affiliated (about 80 percent) worked full time and were mostly male (76 percent).
The online STEM course used in this study has an increased dependency on design and the learning management system than a face-to-face course. Some students find STEM courses more difficult to complete complicating the generalization of these results on non-STEM courses.
The course in this study used graded homework. The theory is that if the homework is not graded, students will have less incentive to complete it. Homework was a small part of the overall grade. Nonetheless, not all courses use graded homework on each chapter.
Recommendations
Administrators should encourage faculty to examine their courses for extraneous workload. Key interest items for administrators and faculty alike is to improve student persistence towards the attainment of degrees. Colleges and universities exist to help students succeed and an implied part of that charge is to design the most effective and efficient courses possible.
The massive move to online education as a student preference serves notice that time conservation is a major factor for students when making college and degree pursuit decisions. Additional research on student perceptions of workload and time management would help course designers to balance the need between academic rigor and student work life balance.
The focus of this study was to determine how to evaluate student performance after removing what was perceived as extraneous workload. The main questions in this study were about the impact of removing such workload, measuring the results of removing quizzes and determining if grade distribution and withdrawals were impacted in any meaningful way. The extraneous workload in this case was quizzes, but in reality depends on the course. Extraneous workload can be discussions, assignments or different types of homework, quizzes, or tests, depending on the course. Future researchers are encouraged to use variants of the methodology in this study to reduce unneeded workload without negatively impacting student performance. The key is focusing on important dependent variables such as a grade on a specific summative assignment, grade distribution, failure rates, and withdrawal rates. Future researchers and course designers need to conduct follow up evaluations of course changes to ensure student performance is not negatively impacted and hopefully enhanced.
Acknowledgements
I would like to express my appreciation to the students we serve, particularly those who work full-time, serve in the military and those who have families. Your hard work and dedication are an inspiration to us all.
References
Bernard, R. M., Abrami, P.C., Lou, Y., Borokhovski, E., Wade, A., Wozney, L., et al. (2004). How does distance education compare with classroom instruction? A meta-analysis of the empirical literature. Review of Educational Research, 74(3), 379-439. https://journals.sagepub.com/doi/10.3102/00346543074003379
Bettinger, E., Loeb, S. (2017). Promises and pitfalls of online education. Brookings. https://www.brookings.edu/articles/promises-and-pitfalls-of-online-education/
Busteed, B. (2019). Online education: From good to better to best? Forbes. https://www.forbes.com/sites/brandonbusteed/2019/03/05/online-education-from-good-to-better-to-best/?sh=6496f5469124
Cooke, C. (2023). In-person vs online learning statistics. Upskillwise. https://upskillwise.com/in-person-vs-online-learning-statistics/
Currie, L. W. (2014). Mathematics anxiety in adult undergraduate business students: A descriptive study [Ph.D., Capella University]. In ProQuest Dissertations and Theses. https://www.proquest.com/docview/1560886025/abstract/13F4AA68120844B8PQ/1
Dhawan, S., (2020). Online learning: A panacea in the time of COVID-19 crisis. Journal of Educational Technology Systems, 49(1), 5-22. https://doi.org/10.1177/0047239520934018
Dunlap, J. (2005). Workload reduction in online courses: Getting some shuteye. Performance Improvement, 44, 18-25. https://doi.org/10.1002/pfi.4140440507
Faulconer, E. K., Griffith, J. C., Wood, B., Acharyya, S., and Roberts, D. L. (2018). A comparison of online, video synchronous, and traditional learning modes for an introductory undergraduate physics course. Journal of Science Education and Technology 27(5), 404-411. https://doi.org/10.1007/s10956-018-9732-6
Fadalgo, P., Thormann, J., Oleksandr, K., & Lencastre, J. (2020). Students’ perceptions on distance education” A multinational study. International Journal of Educational Technology in Higher Education, 17. https://educationaltechnologyjournal.springeropen.com/articles/10.1186/s41239-020-00194-2
Gay, L. R., Mills, G. E., & Airasian, P. W. (2009). Educational research: Competencies for analysis and application (9th ed.). Pearson.
Gensler, L. (2014, February). From correspondence courses to MOOCs: The highlights of distance learning over the ages. Forbes, 12, 2014. https://www.forbes.com/sites/laurengensler/2014/02/12/from-correspondence-classes-to-moocs-the-highlights-of-distance-learning-over-the-ages/?sh=656a42767690
Griffith, J. & Faulconer, E. (2022) Show Me! Do videos make a difference in an asynchronous online course? Online Journal of Distance Learning Administration, 25(2). https://ojdla.com/articles/show-me-do-videos-make-a-difference-in-an-asynchronous-online-course
Griffith, J, C., Faulconer, E. K., and McMasters, B. L. (2021). The relationship between learning mode and student performance in an undergraduate elementary statistics course. International Review of Research in Open and Distributed learning. 22(1), 166-179. http://www.irrodl.org/index.php/irrodl/article/view/5033
Hansen, M. (2022). Cost of online education vs. traditional education. Education Data Initiative. https://educationdata.org/cost-of-online-education-vs-traditional-education
Jaggars, S. S., Edgecombe, N., & Stacey, G. W. (2013). What we know about online course outcomes. In Online Education and Instructional Technology. Community College Research Center. http://ccrc.tc.columbia.edu/publications/what-we-know-online-course-outcomes.html
Kochu, et al., (2022). Student workload assessment for online learning: An empirical analysis during Covid-19). Cogent Engineering, 9(1). https://www.tandfonline.com/doi/full/10.1080/23311916.2021.2010509
McLain, B., P. (2005). Estimating faculty and student workload for interaction in online graduate music courses. Online Learning Journal, 9(3). doi: https://doi.org/10.24059/olj.v9i3.1784.
Palvia, S. et al. (2018). Online Education: Worldwide status, challenges, trends, and implications. Journal of Global Information Technology Management, 21(4), 233-244. https://www.tandfonline.com/doi/pdf/10.1080/1097198X.2018.1542262
Peterson, J. (2019). An analysis of academic dishonesty in online courses. Mid-Western Educational Researcher, 31(1), 24-36. https://www.mwera.org/MWER/volumes/v31/issue1/V31n1-Peterson-FEATURE-ARTICLE.pdf
Roberts, D., Griffith, J., Faulconer, E., Wood, B., & Acharyya, S. (2019). An investigation of the relationship between grades and learning modes in an introductory research methods course. Online Journal of Distance Learning Administration, 22(1), 1-13. https://commons.erau.edu/publication/1405/
Sandars, J., et al. (2020). Twelve tips for rapidly migrating to online learning during the COVID-19 pandemic. MedEdPublish. https://opus.bibliothek.uni-augsburg.de/opus4/frontdoor/deliver/index/docId/80117/file/80117.pdf
Sheridan, R. (2006). Reducing the online instructors’ workload. Educause Quarterly, November. https://er.educause.edu/-/media/files/articles/2006/7/eqm06311.pdf?la=en&hash=C634C2E69AC918B26E6490AA25B19F24C95A2A82
Welding, L. (2023). U.S. College enrollment decline: Facts and figures. Best Colleges. https://www.bestcolleges.com/research/college-enrollment-decline/#:~:text=Today%2C%20fewer%20people%20are%20going,lowest%20fall%20enrollment%20since%202006.&text=The%20NSCRC%20estimates%20that%20even,2023%2C%20just%2014.1%20million%20students
Wyatt, G. (2005). Satisfaction, academic rigor and interaction: Perceptions of online instruction. Education 125(3), 460–468. https://web.s.ebscohost.com/abstract?direct=true&profile=ehost&scope=site&authtype=crawler&jrnl=00131172&AN=16712162&h=%2fG8folYSmkbiyoeAJv6BXzGMo7dH7F8kubLbCq2CwGNjHngg1OFpTWrF0jYJb3Dz7GuXHTgbG2veKvet4JgRuA%3d%3d&crl=c&resultNs=AdminWebAuth&resultLocal=ErrCrlNotAuth&crlhashurl=login.aspx%3fdirect%3dtrue%26profile%3dehost%26scope%3dsite%26authtype%3dcrawler%26jrnl%3d00131172%26AN%3d16712162