
Abstract
Three years of data for 5,617 college online introductory statistics students were examined to determine if embedded course videos reduced incidences of external course tutoring. The frequency of external tutoring in course sections that used embedded videos was significantly reduced by 55% when compared to courses that did not use embedded course videos. These findings were consistent with an earlier study by Griffith & Faulconer (2022) where a statistically significant 40% reduction was found with a smaller sample size (26 months of data). Additionally, study results revealed a significant 51% reduction of tutoring hours for course sections that used embedded course videos. It was theorized that eliminating the need for students to seek external tutoring reduced cognitive load and friction for students which is particularly important in STEM courses taught in an online format. Recommendations include replicating this study methodology in traditional university settings with standard 16 week terms. Study results support the idea that faculty can use embedded course videos to reduce cognitive load and friction and reduce reliance on external tutoring by external tutoring organizations.
Purpose
Online courses are mostly asynchronous by nature resulting in a different interaction dynamic between students and instructors. STEM courses add an additional perceived burden for some students who have had past difficulties with subjects like math, statistics, or physics (Currie, 2014). Instructor presence is supported by the use of videos in online courses since students feel more connected thus increasing the likelihood of success (Seckman, 2018). Although tutoring is helpful, videos can eliminate the need for students to seek external help reducing friction in completing the class (Kozan, 2015). Griffith and Faulconer (2022) determined that the frequency of tutoring sessions was reduced by 40% in course sections that included embedded videos. The study sample used 19 months of courses without, and 7 months of sections with embedded videos. Although the sample was large, a recommendation of the 2022 study was to replicate the research in both traditional and non-traditional settings. The goal of this research is to replicate the 2022 study using a larger sample size. Following Griffith and Faulconer’s (2022) recommendation, the purpose of this study is to determine if videos make any meaningful difference in the reduction of tutoring sessions provided by an external organization.
Introduction and Literature Review
Online courses tend to experience high rates of student failure or withdrawal compared to traditional classroom courses. Additionally, some courses are more difficult than others. STEM courses are seen as barrier courses for some students attempting to complete a degree program (Currie, 2014). Jaggars et al. (2013) reported that student persistence is a major concern with online barrier courses. For these reasons, online course designers have attempted to leverage videos to provide instructor presence fostering connections with students and reducing their cognitive load (Brame, 2016; Gayton, 2015; Kozan, 2015).
Tutoring programs have long been offered by universities to assist students in face to face settings. Online tutoring brings a different approach to this concept. The benefits of online learning allow students to take courses anywhere in the world despite location or time zone differences and online tutoring organizations have adapted to the online education model. When students need additional help, online tutoring programs include 24/7 coverage using tools such as online conferencing to provide additional help enabling student success (Mcpherson & Nunes, 2004; Tutor.com, 2023). Tutor.com states they conduct more than 2 million tutoring sessions annually (2023). Only 1.2% of those who begin the process as tutors are fully onboarded by Tutor.com (2023). Universities contract with this service at a cost of approximately $26 for each hour of tutoring. Depending on the size of the college and number of tutoring sessions, annual costs to universities can quickly climb into the six figures. In addtion to the expense to universities who pay for tutoring is the dynamic or friction of students going to another source outside of class to attempt to learn a subject (Griffith & Faulconer, 2022). One way to reduce reliance on external tutoring is to increase support provided to students from within online courses by using embedded videos (Hsin & Cigas, 2013). Effective videos can reduce cognitive load (friction) and increase active learning (Brame, 2013).
Video Best Practices
Creating videos takes some time but is not out of reach for university faculty who typically have readily available technology. Video production has a set of best practices course designers and instructors should use. If possible, using the university learning management system facilitates efficient video production and simple placement in online courses (Sandars, et al., 2020). Most learning management systems allow for screen sharing with a smaller picture of the instructor in a corner of a screen. Making a short video (6 minutes or less) with one or two main points will keep students’ attention and aid learning more effectively than longer videos with many major points of emphasis (Lin et al., 2017; Hofer, 2015; Hsin & Cigas, 2013; Lagerstrom, 2015; Rush, 2015). Variation in style is also important in keeping students engaged with course videos. A video of faculty teaching behind a learning glass or interacting with software is preferrable to a video of a person (just) speaking (Brame, 2013). Although it may sound counter intuitive, watching videos is not a passive activity. Students benefit from being able to start, stop, pause and replay videos to aid understanding (Hartsell & Yuen, 2006). Videos can be both concept oriented to help students with course concepts and step by step how to demonstrations showing how to run calculations or manipulate software (Griffith & Faulconer, 2022).
Previous Research
Griffith and Faulconer (2022) studied a 200 level introductory statistics course over a 26 month period and found a 40% reduction in tutoring sessions between course sections without (23%) and course sections with (14%) embedded videos. x2(1, 4318) = 38.1, p<.001). The data included 19 months of course sections without videos and seven months with embedded course videos. One concern about the results was the small number of months used in the analysis that had embedded videos. This study replicates the 2022 study but examines a full 36 months of data more evenly split between the sections without (19 months) and sections with (17 months) embedded course videos.
Hypotheses
Ha1 The number of monthly tutoring sessions for course sections without embedded videos is not equal to the number of monthly tutoring sessions for course sections with embedded videos.
Ha2 The number of monthly tutoring hours for course sections without embedded videos is not equal to the number of monthly tutoring hours for course sections with embedded videos.
Methods
The retrospective study analyzed 36 months of tutoring data for 5,617 students enrolled in a 200 level introductory statistics course. Course sections without (19 months) were compared to course sections with (17 months) embedded videos. Faculty and students were unaware that this study was being accomplished.
The Course
Students needed to complete at least one 100 level algebra class to enroll in the statistics course used in this study. The course was offered online with a term length of nine weeks broken into nine one week modules. Major terms were August, October, January, March, and May when most students took courses. A smaller number of course sections were also offered in the remaining months with the exception of December and June.
Each course module included homework on one or two chapters, one quiz and a discussion or assignment. Summative testing was accomplished on a midterm in module 5 and practical final exam in modules 8 and 9. Students used a Pearson textbook accompanied by website access to homework, quizzes, and the midterm. The Pearson package included a statistical package (StatCrunch) to run tests on provided data. Microsoft Excel was also used in a discussion, assignment and both parts of the practical final exam in modules 8 and 9.
Canvas was the learning management system used for the course and has a direct link to Tutor.com. The external Tutor.com contract has been in place since 2016. Faculty were able to interact with students in a variety of ways; (1) through the Canvas messaging system, (2) feedback on assignments through rubrics, (3) rubric open comment areas, and (4) discussion boards. Students could also arrange a time to videoconference the course section instructor through Zoom which was built into the Canvas (learning management system) template.
Videos
The course designer developed 14 concept and 18 step by step how to videos. Concept videos included the normal curve, sampling, types of data and correlation. How to videos showed students how to manipulate StatCrunch and Microsoft Excel software to run various types of tests. Video presentation also used different formats. Learning Glass videos (where the instructor teaches from behind a glass) lent themselves to explaining concepts or demonstrating handwritten formulas. Screen sharing videos, made through the learning management system, were primarily used to demonstrate how to manipulate software to run statistical tests. Even in the case of screen sharing videos, the instructor faced the students when explaining the concept or the steps to establish instructor presence. Videos followed the best practices of being short (under six minutes) and focused on a major concept or procedure with a limited number of subpoints. Standardized placement was deemed important in the course design. Videos were placed in the Readings and Resources tabs in the beginning of seven modules helping students to know exactly where to find them. One how to video was placed directly into a discussion as a just in time demonstration. In all cases, the language was kept simple with an enthusiastic delivery. One video provided a sampling example focused on the mistake made in the 2000 presidential election where Florida was initially called inaccurately because the first reported exit poll survey did not include the panhandle of the state which was overwhelmingly conservative. Another video discussed how a blood test was a representative sample of blood in the body. Citing more common examples an additional video demonstrated the types of data used in statistics differentiating between yes and no answers (nominal), rating movies from one to five stars (ordinal), the Fahrenheit temperature scale (interval) and money (ratio). In all cases the goal was to give an example, then state how a statistical concept applied to that example.
In addtion to the videos produced by the course developer, the course also featured 22 videos from YouTube and the textbook publisher. The course design attempted to ensure videos were placed in the course within the same module the concept or demonstrated procedure was needed by students.
Participants and Demographics
Participants did not know they would be part of a study. Typical students in this university have some military affiliation (50% enlisted active duty, 30% veteran GI Bill or active duty dependent). The typical student was male (76%) and in their mid-thirties with a family. Most students lived in or near military bases around the world. Typically, students transferred in some college credit from regionally accredited universities. Many chose the university used in this study because of the 9 week term format (accelerated program). Students chose to enroll into online course sections due to the flexible format. Most students wanted to complete a bachelor’s degree to support promotion or commissioning goals. Some senior enlisted students were preparing for employment once leaving the military.
Design Evaluating the Use of Videos
Ex post facto research was conducted on tutoring data broken out by month. The tutoring data was the dependent variable in this research. The independent variable was the 54 embedded videos in the course of which 32 were made by the course developer. The 32 videos created by the course developer comprised of 14 concept and 18 how to demonstrations. The remaining 22 videos were sourced from YouTube (11) and standard publisher videos that accompanied the text (11).
Treatment of the Data
Monthly tutoring data was divided into two groups. The first group covered course sections that did not use embedded videos (January 2020 through July 2021). The second group of data covered sections that used embedded course videos (August 2021 through December 2022). The number of monthly tutoring sessions were compared to determine if there were any significant differences between the two groups of data.
The first hypothesis was originally tested using a t Test for independent samples (α=.025) which compared the difference between the means of the months covering courses without and with embedded videos. However, the Shapiro-Wilk normality test showed that one of the samples (with embedded videos) was not normally distributed (W= 0.875, p= 0.026). Based on this outcome, a non-parametric Mann-Whitney U test (Bonferroni adjusted α=.025) was used to compare the two samples and the median with the interquartile range were used to summarize the variable (Gay et al., 2009).
The second hypothesis regarding the average monthly tutoring hours for course sections without and with embedded course videos was evaluated using a t test for independent samples again using a Bonferroni adjusted alpha (α=.025) in order to prevent a type one error (Gay et al., 2009).
Results
Tutoring Sessions
Two samples were compared to test the hypothesis that the number of tutoring sessions was not equivalent between course sections without embedded videos and course sections with embedded videos. The first sample (sections without embedded videos) covered 19 months. The second sample was 17 months of data for course sections with embedded videos. As explained in the prior section, A t Test was initially conducted between the two samples, however, the Shapiro-Willk result indicated that the sample covering course sections with embedded videos was not normally distributed. Therefore, the data were retested using the non-parametric Mann-Whitney U test. The number of monthly tutoring sessions for course sections without embedded videos had a median of 42, (IQR 24-51). The number of monthly tutoring sessions for course sections with embedded videos had a median of 14 (IQR 10-24). Mann-Whitney U test results showed that monthly totals for course sections that did not include embedded videos experienced were significantly higher than monthly totals for course sections that use embedded videos (U = (19Without videos, 17With videos), 462.5, p<.001). These results are shown visually in Figure 1.
Figure 1
Boxplots of Tutoring Session Monthly Medians Without and With Embedded Videos
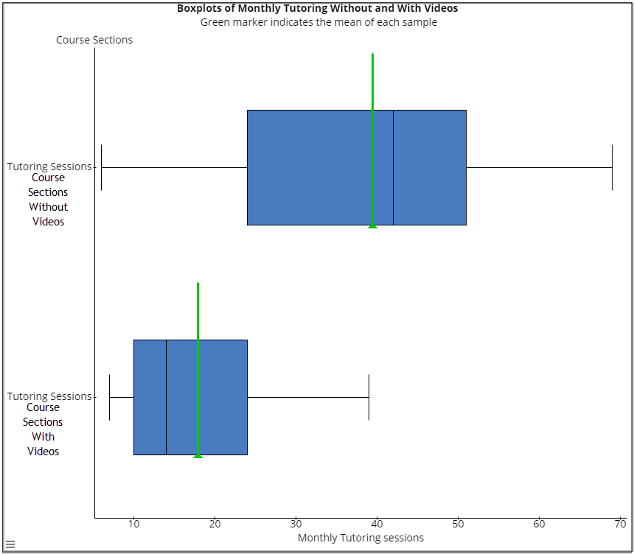
Note. The top boxplot shows results for 19 months of course sections without embedded videos with a median of 42, (IQR 24-51). Although not important to the Mann-Whitney U test, the mean (39.47) is shown by the green bar to the left of the median in the upper box plot. The lower boxplot shows results for 17 months of course sections that used embedded course videos with a median of 14 (IQR 10-24). Although not important to the Mann-Whitney U test, the mean (17.94) is shown to the right of the median of the lower box plot. Data were calculated using StatCrunch statistical software.
Results indicated that the 17 months of tutoring data for course sections with embedded course videos showed significantly lower number of tutoring sessions per month than for the 19 months of tutoring data for course sections without embedded videos.
Average Monthly Tutoring Hours Comparison
The average monthly number of tutoring hours were compared between courses without embedded videos vs course sections with embedded course videos. Course section monthly averages without (n=19) embedded videos were significantly higher (M=16.77, SD=8.47) than monthly averages for course sections with (n=17) embedded videos (M=8.25, SD=5.03), a 51% reduction revealing a t-static of 3.72 with df =29.8 p<.001.
Due to the significant differences between the two groups of data, both null hypotheses were rejected in this study. Study results showed significantly fewer tutoring sessions and hours were required for course sections using embedded course videos.
Discussion
In this study, monthly totals of external tutoring were 55% lower for course sections with embedded videos than for course sections that did not use embedded videos. Embedded video course section students appeared to get the information they needed from within the course rather than take the time to look for help externally. The theoretical conclusion is that students incurred less friction while completing course sections with embedded videos because they did not have to figure out the process of obtaining external tutoring. Additionally, the number of monthly tutoring hours and the cost of providing those sessions for this course was reduced by 51%
Conclusions
The results of this study mirror the results of the 2022 study by Griffith and Faulconer. In that study, 26 months of data were examined with a 40% reduction in tutoring when comparing course sections without and with tutoring. The replication of that study was purposefully done due to the idea that only seven months of course sections that used embedded videos were compared against 19 months of sections without embedded videos. Although the 2022 study was fundamentally sound, replication of the research reinforces the idea that there is statistical evidence to support the idea that use of embedded videos significantly reduces tutoring sessions by external agencies such as Tutor.com. Moreover, the potential cost savings are also attractive to those considering using embedded videos to reduce the amount of billable hours from external tutoring services.
Limitations
The 9 week term accelerated course format is unusual at most colleges and universities. This study only included results for terms that lasted 9 weeks versus the more typical 15 or 16 week term. The impact of term length on results was not a part of this study.
Online courses have different dynamics of teaching and learning than traditional classroom settings. Results of this research did not take in to account any differences between online and traditional classroom settings.
The student population of the university in this study is not similar to a prototypical college or university campus. Students in their 30s have different pressures outside of the classroom than 18-22 year old students found at traditional university settings. Additionally, traditional college campuses have a more equal balance between male and female students. Gender differences were not addressed in this study.
Most of the student population at the university used for this research are military or military affiliated. These students greatly differ in life experiences, responsibilities outside of class and motivations when compared to a student body at a traditional university setting.
Covid impacts were not addressed in this study. In the case of the university used for this research, online enrollments actually increased during Covid. The impact of any pressures students experienced outside of class were not addressed in this study and could impact the results.
Recommendations
The methodology used in this study should be replicated in traditional college and university settings to account for a more equal gender mix, and more traditional student population.
Educators and course designers should explore the use of videos using best practices discussed in this research to reduce friction and cognitive load for students.
Higher Education Administrators should encourage faculty to experiment and use videos in course design not only to help students but reduce reliance on external tutoring agencies and reduce costs.
Acknowledgements
The author acknowledges our students who are attempting to make their lives better through education. Our students are the reason we as educators exist and it is our responsibility as teachers and administrators to provide the best education possible to help our students succeed.
References
Brame, C. (2016). Effective educational videos: principles and guidelines for maximizing student learning from video content. CBE Life Science Education, 15(4) https://doi.org/10.1187%2Fcbe.16-03-0125
Currie, L. W. (2014). Mathematics anxiety in adult undergraduate business students: A descriptive study [Ph.D., Capella University]. In ProQuest Dissertations and Theses. https://www.proquest.com/docview/1560886025/abstract/13F4AA68120844B8PQ/1
Gay, L. R., Mills, G. E., & Airasian, P. W. (2009). Educational research: Competencies for analysis and application (9th ed.). Pearson.
Griffith, J. & Faulconer, E. (2022) Show Me! Do videos make a difference in an asynchronous online course? Online Journal of Distance Learning Administration, 25(2). https://ojdla.com/articles/show-me-do-videos-make-a-difference-in-an-asynchronous-online-course
Hartsell, T., & Yuen, S. C.-Y. (2006). Video streaming in online learning. AACE Review (Formerly AACE Journal), 14(1), 31–43.
Hofer, M. (2015). 5 tips for creating inspiring course trailers. http://www.luminaris.link/blog/5-tips-for-creating-inspiring-course-trailers
Hsin, W., Cigas, J. (2013). Short videos improve student learning in online education. Journal of Computing Sciences in Colleges, 28(5), 253-259. https://dl.acm.org/doi/abs/10.5555/2458569.2458622
Jaggars, S. S., Edgecombe, N., & Stacey, G. W. (2013). What we know about online course outcomes. In Online Education and Instructional Technology. Community College Research Center. https://ccrc.tc.columbia.edu/media/k2/attachments/online-learning-practitioner-packet.pdf
Kozan, K. (2015). The predictive power of the presences on cognitive load: Vol. Ph.D. https://docs.lib.purdue.edu/open_access_dissertations/491
Lagerstrom, L., Johanes, P., & Ponsckcharoen, U. (2015). The myth of the six-minute rule: Engagement with online videos. 2015 American Society for Engineering Education, Seattle WA. Doi: 10.18260/p.24895. https://peer.asee.org/the-myth-of-the-six-minute-rule-student-engagement-with-online-videos
Lin et al. (2017). Exploring physics students’ engagement with online instructional videos in an introductory mechanics course. Physical Review Physics Education Research. https://journals.aps.org/prper/abstract/10.1103/PhysRevPhysEducRes.13.020138
McPherson, M., Nunes, M. (2004). The role of tutors as an integral part of online teaching support. European Journal of Open, Distance and E-Learning. https://old.eurodl.org/?p=archives&year=2004&halfyear=2&article=105
Sandars, J., et al. (2020). Twelve tips for rapidly migrating to online learning during the COVID-19 pandemic. MedEdPublish. https://opus.bibliothek.uni-augsburg.de/opus4/frontdoor/deliver/index/docId/80117/file/80117.pdf
Rush, A. (2015). Course trailers. Retrieved from https://digitalmediacookbook.com/course-trailers/
Seckman, C. (2018). Impact of interactive video communication versus text-based feedback on teaching, social, and cognitive presence in online learning communities. Nurse Educator, 43(1), 18–22. https://doi.org/10.1097/NNE.0000000000000448
Tutor.com. (2023). About us. Author. https://www.tutor.com/about-us